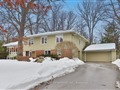
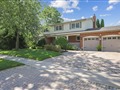
1610 Indian Grve
$3,200,006
Comparative Market Analysis
Jul 10, 2025
NOT AN ACTIVE LISTING
Historical Performance
| Period | $ Change | % Change |
| 1 Day | +$601 | +0.019% |
| 7 Days | +$3,124 | +0.098% |
| 30 Days | +$9,973 | +0.313% |
| 3 Months | +$48.2k | +1.53% |
| 6 Months | +$182k | +6.02% |
| 1 Year | +$168k | +5.53% |
| 3 Years | +$1.69m | +112% |
| 5 Years | +$2.59m | +423% |
| 10 Years | +$2.83m | +771% |
List My Property
Real Estate Statistics
Financing Solutions
AS SEEN ON


Are You a Licensed Real Estate Agent or Broker?