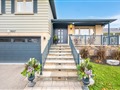
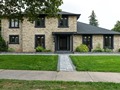
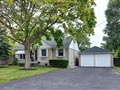
2067 Chippewa Tr
$2,217,448
Comparative Market Analysis
Jun 7, 2025
NOT AN ACTIVE LISTING
Historical Performance
| Period | $ Change | % Change |
| 1 Day | +$470 | +0.021% |
| 7 Days | +$418 | +0.019% |
| 30 Days | -$2,242 | -0.101% |
| 3 Months | +$2,249 | +0.102% |
| 6 Months | +$59.0k | +2.73% |
| 1 Year | -$45.7k | -2.02% |
| 3 Years | +$540k | +32.2% |
| 5 Years | +$868k | +64.3% |
| 10 Years | +$1.35m | +155% |
List My Property
Real Estate Statistics
Financing Solutions
Browsing History
4567 Donegal Dr, Mississauga
2 seconds ago
4120 Trapper Cres, Mississauga
3 seconds ago
6146 Rowers Cres, Mississauga
4 seconds ago
3351 Cawthra Rd 201, Mississauga
5 seconds ago
4051 Taffey Cres, Mississauga
6 seconds ago
3487 Sanderling Cres, Mississauga
7 seconds ago
3277 Kings Masting Cres, Mississauga
8 seconds ago
4002 Taffey Cres, Mississauga
9 seconds ago
2370 Woking Cres, Mississauga
10 seconds ago
3291 Charlebrook Crt, Mississauga
11 seconds ago
AS SEEN ON


Are You a Licensed Real Estate Agent or Broker?