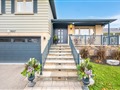
2101 Shawanaga Tr
$3,207,194
Comparative Market Analysis
Jun 6, 2025
NOT AN ACTIVE LISTING
Historical Performance
| Period | $ Change | % Change |
| 1 Day | +$680 | +0.021% |
| 7 Days | +$863 | +0.027% |
| 30 Days | -$2,069 | -0.064% |
| 3 Months | +$6,222 | +0.194% |
| 6 Months | +$89.0k | +2.85% |
| 1 Year | -$67.7k | -2.07% |
| 3 Years | +$800k | +33.3% |
| 5 Years | +$1.53m | +91.0% |
| 10 Years | +$2.29m | +250% |
List My Property
Real Estate Statistics
Financing Solutions
Browsing History
400 Mississauga Valley Blvd 69, Mississauga
2 seconds ago
3985 Grand Park Dr 2204, Mississauga
3 seconds ago
3975 Grand Park Dr 2602, Mississauga
4 seconds ago
2709 Romark Mews, Mississauga
5 seconds ago
1762 Sevenoaks Dr, Mississauga
6 seconds ago
35 Kingsbridge Garden Circ 3006, Mississauga
7 seconds ago
3111 Orleans Rd, Mississauga
8 seconds ago
3985 Grand Park Dr 1204, Mississauga
9 seconds ago
700 Constellation Dr 1205, Mississauga
10 seconds ago
180 Mississauga Valley Blvd 76, Mississauga
11 seconds ago
AS SEEN ON


Are You a Licensed Real Estate Agent or Broker?