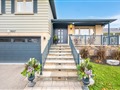
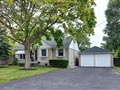
2262 Shawanaga Tr
$2,866,493
Comparative Market Analysis
Apr 12, 2025
NOT AN ACTIVE LISTING
Historical Performance
| Period | $ Change | % Change |
| 1 Day | +$607 | +0.021% |
| 7 Days | +$162 | +0.006% |
| 30 Days | -$4,809 | -0.167% |
| 3 Months | -$3,782 | -0.132% |
| 6 Months | +$61.0k | +2.17% |
| 1 Year | -$100k | -3.38% |
| 3 Years | +$576k | +25.2% |
| 5 Years | +$1.01m | +54.7% |
| 10 Years | +$1.54m | +115% |
List My Property
Real Estate Statistics
Financing Solutions
Browsing History
2664 Altadena Crt, Mississauga
2 seconds ago
2039 Shawanaga Tr, Mississauga
3 seconds ago
2672 Misener Cres, Mississauga
5 seconds ago
2317 Belfast Cres, Mississauga
5 seconds ago
2247 Belfast Cres, Mississauga
7 seconds ago
2496 Hornsgate Dr, Mississauga
7 seconds ago
2566 Misener Cres, Mississauga
7 seconds ago
AS SEEN ON


Are You a Licensed Real Estate Agent or Broker?