PROPERTY DESCRIPTION
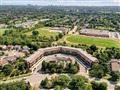
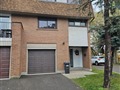
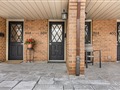
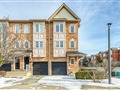
3065 Lenester Dr 13 is a 3-bedroom 3-washroom condo townhouse located in Erindale community of Mississauga. It is currently NOT FOR SALE, but is
worth in our opinion around $735,495
.
3065 Lenester Dr 13 is currently not for sale and is not an active listing on Listing.ca.
NEARBY SCHOOLS
Al Huda Schools
1.7 km
838 Damien Way, L5C3H3
Phone: (905) 277-8478
Bradford Alternative School
0.7 km
3225 Erindale Station Rd, L5C1Y5
Phone: (905) 775-9878
Dufferin-Peel Catholic District School Board
0.8 km
1300 McBride Av, L5C1M8
Phone: (905) 277-4512
Dufferin-Peel Catholic District School Board
1.5 km
2470 Rosemary Dr, L5C1X2
Phone: (905) 279-3171
Dufferin-Peel Catholic District School Board
1.1 km
915 McBride Ave, L5C1M1
Phone: (905) 279-9478
Ellengale Public School
1.2 km
3480 Ellengale Dr, L5C1Z7
Phone: (905) 279-1555
Emmanuel Academy
6.3 km
1090 Dundas St E, L4Y2B8
Phone: (905) 268-0771
Emmanuel College Of Business,Healthcare and Technology
6.3 km
1090 Dundas St E, L4Y2B8
Phone: (905) 268-0772
Erindale Nursery School
1.2 km
2438 Glengarry Rd, L5C1Y2
Phone: (905) 848-8780
Hawthorn Public School
1.5 km
2473 Rosemary Dr, L5C1X1
Phone: (905) 277-4321
McBride Public School
1.1 km
974 McBride Ave, L5C1L6
Phone: (905) 270-6414
Peel District School Board
0.7 km
3225 Erindale Station Rd, L5C1Y5
Phone: (905) 279-0435
Queenston Drive P S
1.1 km
3520 Queenston Dr, L5C2G6
Phone: (905) 277-9523
The Northridge Montessori School
2.5 km
2185 Stavebank Rd, L5C1T3
Phone: (905) 281-0840
The Woodlands Elementary
0.7 km
3225 Erindale Station Rd, L5C1Y5
Phone: (905) 279-0575
NEARBY RESTAURANTS AND CAFETERIAS