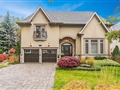
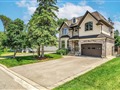
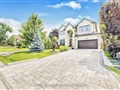
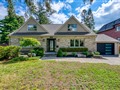
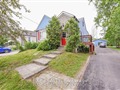
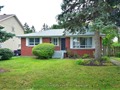
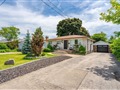
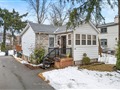
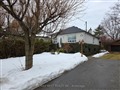
58 Indian Valley Tr
$3,154,510
Comparative Market Analysis
Jun 1, 2025
NOT AN ACTIVE LISTING
Historical Performance
| Period | $ Change | % Change |
| 1 Day | +$620 | +0.020% |
| 7 Days | -$461 | -0.015% |
| 30 Days | -$8,006 | -0.253% |
| 3 Months | -$12.6k | -0.399% |
| 6 Months | +$49.0k | +1.58% |
| 1 Year | -$159k | -4.80% |
| 3 Years | +$283k | +9.85% |
| 5 Years | +$811k | +34.6% |
| 10 Years | +$1.74m | +122% |
List My Property
Real Estate Statistics
Financing Solutions
Browsing History
4090 Living Arts Dr 807, Mississauga
1 second ago
4090 Living Arts Dr 1708, Mississauga
1 second ago
4090 Living Arts Dr 2802, Mississauga
1 second ago
4090 Living Arts Dr 2704, Mississauga
1 second ago
4090 Living Arts Dr 1706, Mississauga
2 seconds ago
4090 Living Arts Dr 2701, Mississauga
2 seconds ago
4090 Living Arts Dr 2910, Mississauga
2 seconds ago
4090 Living Arts Dr 2806, Mississauga
3 seconds ago
4090 Living Arts Dr 1210, Mississauga
3 seconds ago
AS SEEN ON


Are You a Licensed Real Estate Agent or Broker?